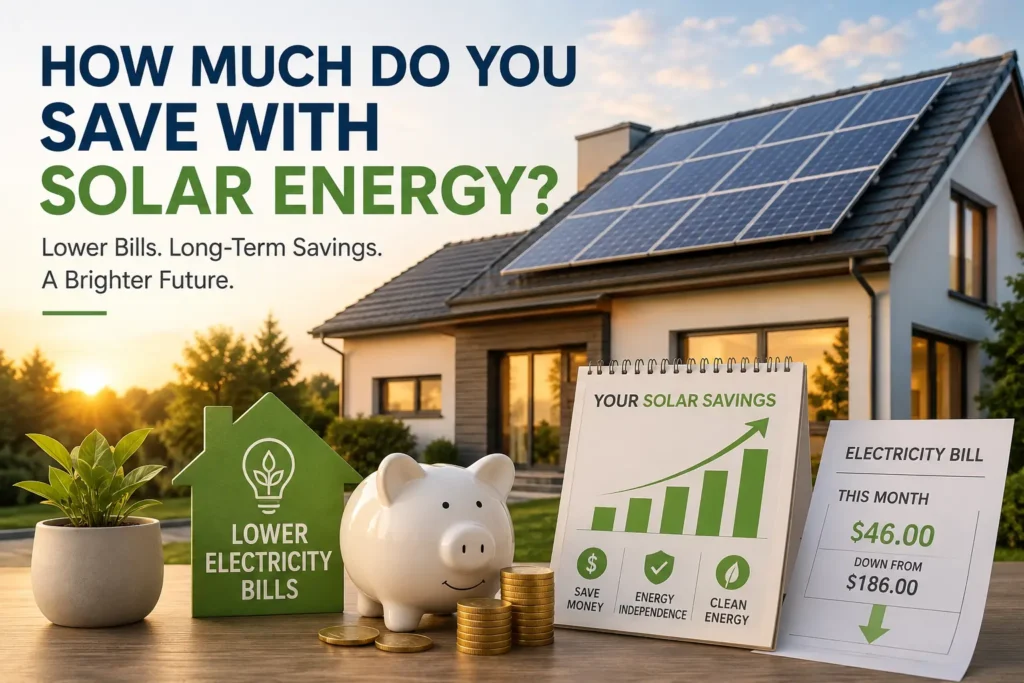
Electricity costs have been on the rise, and locking in lower energy bills is one of the top reasons homeowners install solar panels. While every home is different, solar can translate into significant savings on your utility bills over the years. On average, the typical U.S. household could save tens of thousands of dollars over a 20–25 year period by generating their own power. For example, industry analyses find that most homeowners save around $61,000 over 25 years from solar panels, with typical ranges of roughly $37,000–$154,000 in lifetime bill reductions (depending on location and usage). These savings come from producing free electricity at whatever rate your panels generate, instead of buying it at rising utility prices.
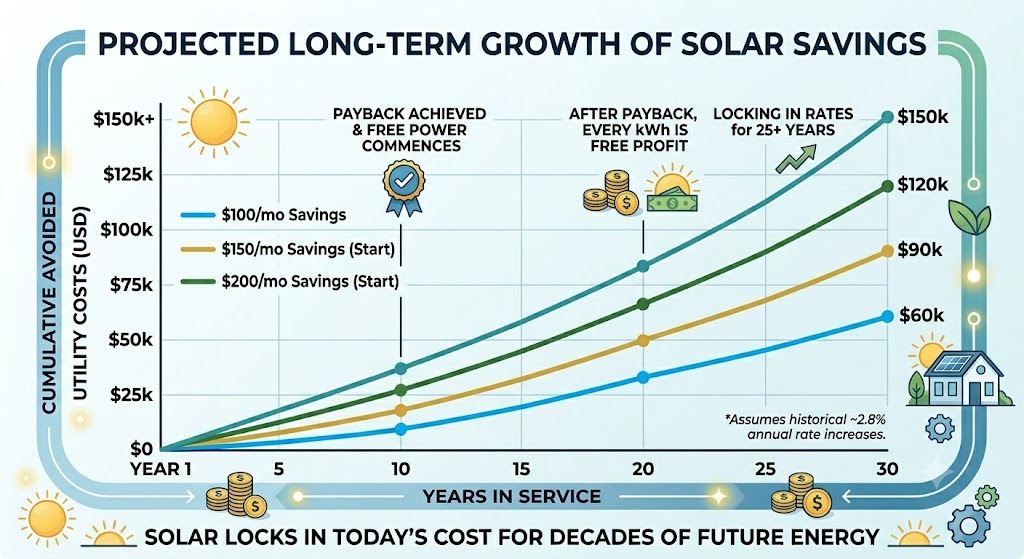
Real savings depend on many factors (see below), but one constant is that solar locks in today’s cost for decades of future energy. Over the past decade, U.S. electricity rates have climbed about 32% in total (roughly 2.8% per year), so every kWh you generate yourself avoids those annual rate hikes. Even if solar doesn’t cover 100% of your needs, the cheaper rates you effectively pay for your own power add up significantly. In short, solar panels do reduce electricity bills—often dramatically—and over time those savings compound into substantial long-term benefits.
(For context on system costs and ROI, see our complete guide to [solar panel costs and ROI].)
How Much Do You Save With Solar Energy on Average?
It’s hard to pin down one “average” savings because every household is unique (different usage, rates, roof, etc.). However, broad estimates can set expectations. For the average U.S. home (around 10,000–11,000 kWh/year usage) solar can cut a large portion of the bill. One analysis estimates the average homeowner saves about $1,500 per year (≈$130/month) with solar, which adds up to roughly $37,000–$61,000 in 25 years. For example, if your current bill is $1,800/year, a well-sized solar system in a typical sun-rich region might offset 70–80% of usage, saving $1,200–$1,400 annually and reducing the bill to only a few hundred dollars.
Even if that seems less than “going to zero,” it’s still significant. Consider this: paying $100/month now ($1,200/year) would, at 2.8% inflation, cost about $33,000 over 20 years. By generating your own electricity, you avoid nearly all of that cost. In fact, if solar saves $100/mo, you would avoid roughly $32,800 in utility spending over 20 years. And as electricity rates climb, that avoided cost grows. The key is that solar lets you cap your power price at the utility’s rate of installation, so you no longer pay rising grid rates out of pocket.
“One family I worked with in California had a $200/month bill. After putting in a solar system (~$15k net after tax credit), they saved about $200/month and fully recouped their investment in under 5 years. After that, their solar electricity was essentially free.”
(Of course, results vary. The range of savings can be wide. Some households might only save a few hundred dollars per year, while others – especially those in very sunny, high-rate states – can save over $2,000 per year. The scenarios below break down typical cases.)
How Much Can I Save With Solar Energy?
Your actual savings depend on how much electricity you use (and when), and the local cost of power. Here are rough examples for different household sizes and usage patterns. These assume a 20–25 year panel life and no future changes in behavior (actual inflation and solar production will impact totals):
- Small household (light usage): ~5,000 kWh/year. At a national average ~$0.18/kWh, the utility bill is ~$900/year. A small 3–4 kW system might cover ~80–90% of that, saving around $700–$800 per year, or ~$18,000–$20,000 over 25 years.
- Medium home (typical family): ~10,000 kWh/year. Bill ~$1,800/year. A 6–8 kW system might offset ~75–80% of usage. You could save roughly $1,400–$1,600 per year, on the order of $35,000–$40,000 in 25 years.
- Large family: ~15,000 kWh/year. Bill ~$2,700/year. An 8–10 kW system might cover ~60–70%. Savings could be $1,500–$1,900 per year, totaling $40,000–$50,000+ over 25 years.
- Heavy users (EVs, big air conditioning, etc.): ~20,000 kWh/year. Bill ~$3,600/year. A 10–12 kW system might cover ~50–60%. Annual savings might be $1,800–$2,100, or $45,000–$52,000 over 25 years (more if electricity is expensive).
Of course, these are ballpark figures. In high-rate states (CA, NY, etc.), multiply the savings by ~1.5–2× because each kWh saved is worth more. In low-rate areas, savings are smaller. Also note that solar panels tend to degrade ~0.5–1% per year, so long-term output will slowly drop.
“One retired couple I helped in Arizona used only about 400 kWh per month (roughly 5,000 kWh/year). They were concerned that solar wouldn’t pay off. We installed a modest 4 kW system, and now they’ve cut their annual bill by about $800, basically to just the fixed minimum charge. They say paying $10/month instead of $90 feels like a big win.”
(The table below summarizes typical cases.)
| Household Type | Annual Usage (kWh) | Avg. Monthly Bill | Solar % Coverage | Est. Annual Savings |
|---|---|---|---|---|
| Small (single/couple) | ~5,000 | ~$75 | ~80-90% | ~$600–$800 |
| Medium (2-3 person) | ~10,000 | ~$150 | ~70-80% | ~$1,300–$1,600 |
| Large family (3-4 kids) | ~15,000 | ~$225 | ~60-70% | ~$1,600–$1,900 |
| Very High (EV/Aircon) | ~20,000 | ~$300 | ~50-60% | ~$1,800–$2,100 |
Savings assume a moderate solar offset of usage and average $0.18–$0.20/kWh. Actual results depend on your local rate and system size.
Do Solar Panels Reduce Electricity Bills?
Yes – but rarely to zero. When your panels are producing, they send power directly to your home, so you buy much less from the grid. In practice, most solar owners see their bills drop by 50–80% immediately, especially in sunny months. For example, EnergySage notes that even if a system doesn’t cover 100% of needs, the savings add up significantly when you avoid buying expensive utility power. Many people see their monthly electricity charges shrink dramatically (a few homeowners even report bills under $50 in peak months).
However, you will almost always still get a utility bill. Solar panels stop at night and produce less on cloudy days. Most homes still draw grid power for some portion of their usage, so you’ll have charges for that power. In addition, utilities impose fixed monthly fees (for meter, grid maintenance, etc.) that solar cannot erase. Even if you import zero kWh, you still pay service charges – often $10–$40 per month depending on your utility.
“One homeowner I met expected their bill to disappear entirely in summer. But we saw their AC ran mostly after sundown. They did cut their bill in half by shifting some chores to midday – laundry, dishwashing, EV charging – but they still pay a small amount to the utility for nights and base fees.”
Net metering helps offset the rest. When you produce excess solar, most utilities credit you for it (often at full retail rate, though some states are cutting this rate). These credits roll over to your bill and can cancel out winter or nighttime consumption. If your system consistently produces more than you use over the year, you might get a $0 bill (or even a small payment from the utility). But with one-to-one net metering gone in many places, surplus power is often credited at a lower rate, meaning some value is lost. Without any net metering (in rare cases), unused solar just spills to the grid for no credit, so sizing your system properly becomes crucial.
In short: Expect your bills to drop substantially, often to under half of what they were. But very few grid-tied homes see an absolute zero bill every month because of nighttime use, service fees, and billing rules. Even so, dramatically lower bills – and insulation from rate hikes – are the norm.
Five Factors That Determine Your Solar Savings
Your solar payoff isn’t a fixed number; it depends on key household and local factors:
- Electricity usage (kWh): More usage means more you can offset. A 12,000 kWh/year home can potentially save double what a 6,000 kWh home saves (all else equal). Higher usage usually means a larger system, but it also means more power produced to cut out pricey grid electricity.
- Electricity price ($/kWh): The higher the cost of grid power in your area, the more each solar kWh is worth. Homes paying 20–30¢/kWh (e.g. Hawaii, CA, MA) unlock much bigger savings than homes paying 8–10¢ (some Midwest/Southeast areas). As EnergySage notes, “the higher your local electricity prices, the greater your potential for solar savings”. In fact, roughly speaking, if you pay under $0.10/kWh, payback may take longer, whereas rates above $0.12/kWh often make solar pay off faster.
- System size (kW): A bigger system produces more of your needs. However, simply adding panels beyond your usage isn’t always helpful. A correctly sized system (covering 70–100% of annual needs) maximizes self-consumption. An oversized system might export a lot of excess (valuable only if net-metered) and add unnecessary upfront cost.
- Roof orientation and sun exposure: South-facing, unshaded roofs with optimal tilt get the most sun. East- or west-facing roofs yield ~10–20% less energy. Heavy shade (trees, buildings) can significantly cut production. If your roof isn’t ideal, you may need a larger system to get the same output, or you may simply produce less than anticipated.
- Timing of energy use (self-consumption): When do you use power? If most of your electricity is used during daylight hours, you’ll directly consume more solar output, saving more. If you use most power at night (e.g. nighttime EV charging or heating), you export a larger share and rely on credits. Energy experts emphasize self-use: using your own solar power “directly powers your home for $0 to your utility provider”. For example, running your refrigerator on solar-generated power is free – if instead you sent that power to the grid and pulled it later, you may only get partial credit, potentially “paying your utility for power you could have used for free”.
- Net Metering & Policies: Finally, your utility’s net metering rules greatly influence savings. In full retail net metering, exported energy is credited 1-for-1, maximizing savings. Newer policies (like California’s NEM 3.0) credit at ~75% less, so homes there benefit more by self-consuming or adding storage. If your utility has no buyback program, excess solar yields no credit, so any un-used generation is essentially wasted.
Putting it together, two homes with identical panels can save very different amounts. A south-facing roof with high rates and heavy daytime usage will see huge bills eliminated, whereas a shaded roof with low rates and night-centric use will save much less. The chart below shows how annual savings can range under different conditions:
- Solar system sized for moderate usage (e.g. 6–8 kW).
- Average residential rate (~18¢/kWh); high-rate states get more, low-rate get less.
- Self-consumption assumed ~70%.
“A homeowner in Texas had high bills and decided to oversize their system. It produced a lot, but without sufficient storage or full net metering, many kWh went to the grid at low credit value. We had to re-calculate their payback – it ended up being longer than expected. Oversizing only helps if you use or get full credit for the extra production.”
How Solar Savings Add Up Over Time
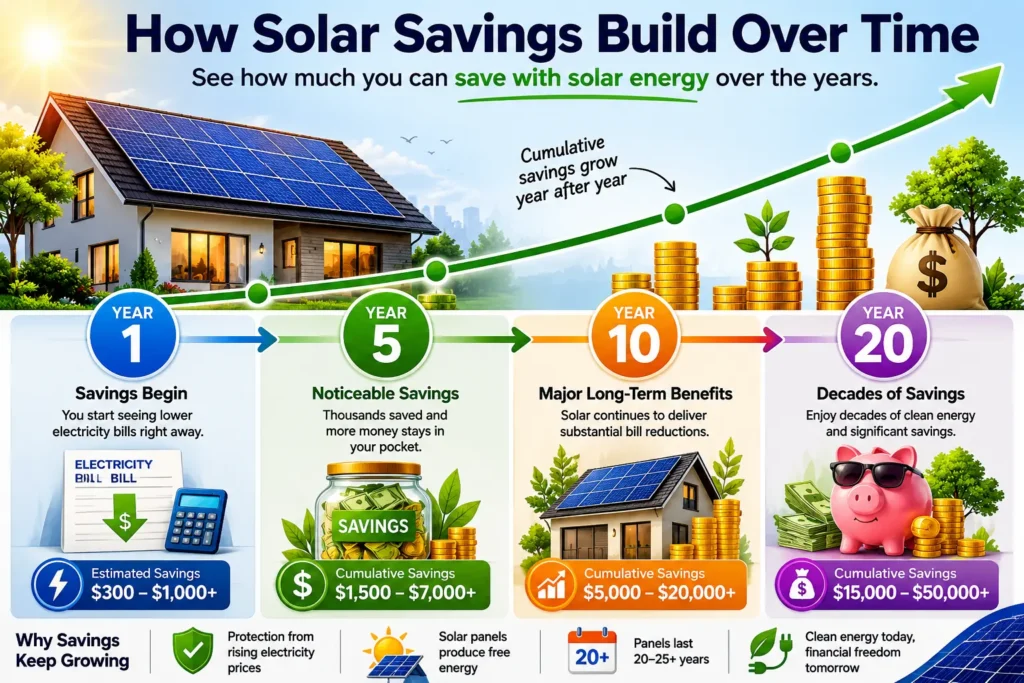
Solar is a long game. In Year 1, you save roughly what you would have paid for the solar-generated power in that year. But over time, as electricity rates climb, each year’s “free” power is worth more and more. Here’s a typical timeline (assuming ~2.8% annual inflation on grid rates as per historical average):
- Year 1: You might save a few hundred to a couple thousand dollars (depending on system size and usage). For example, if your solar offsets $150/mo originally, that’s ~$1,800 saved in the first year.
- Year 5: With inflation, that $150/mo in Year 1 grows to the equivalent of ~$171/mo in Year 5. Cumulatively, you’ve avoided roughly $9,000–$10,000 in utility payments.
- Year 10: That $150/mo is now like paying ~$200/mo in 10 years. You’ve avoided about $22,000 total (assuming consistent output and inflation).
- Year 20: You’ve locked out over $50,000 of utility costs. For instance, someone avoiding $100/mo now would have avoided ~$32,800 over 20 years. Scaling up to larger savings, someone avoiding $150–$200/mo could escape $49,000–$66,000 in two decades.
“After the fifth year, my homeowner client was effectively generating 8 kW of power at zero fuel cost. She told me: ‘It’s like I have a 100% discount on my electricity check.’ Even with a loan, she pays far less to the bank than she would have to the utility, locking in an electricity rate that will never rise.”
In practice, most systems last 25–30 years. By then, total avoided costs can reach into the six figures for large systems in high-rate areas. EnergySage’s chart illustrates that a $100/mo saving today equates to nearly $33K over 20 years. Crucially, after you hit payback (often 5–15 years), every dollar of solar-generated power is virtually free profit.
When Solar Savings Are Lower Than Expected
Solar isn’t magic money, so there are situations where it under-delivers relative to hopes:
- Poor Sizing or Shading: If the system was undersized to save cost, or the roof has shade, you simply get less power. Low production means smaller savings. Conversely, an oversized system in a low-use home might flood the grid with credits that aren’t fully compensated under some net-metering rules, so the extra panels don’t pay off as planned.
- Low Daytime Consumption: If your family uses most electricity at night (kids gaming after dark, or EV charging only overnight), much of your solar output has to be exported/borrowed from. The less you self-consume, the more you rely on net-meter credits. When net-metering isn’t 1-for-1, exporting becomes less profitable.
- High Fixed Charges: Some utilities have high minimum bills or fixed fees that solar doesn’t avoid. You might save $100–$200 on energy but still pay a $30+ service charge. In those cases, your bill bottoms out at that fee rather than $0. Some homeowners are disappointed when their “lowest bill” is still $20–$50 instead of zero.
- Unrealistic Expectations: Believing the electric bill will vanish overnight is a common mistake. Even with perfect system sizing, night and standby consumption remain. One installer noted that a customer had expected “instant zero bills,” but it took tweaking usage habits (running appliances by day) to see real savings. Managing expectations is key.
- Policy Changes: As net-metering rules shift (e.g. NEM 3.0 in California), the value of exported solar can drop. A homeowner who designed a system under old rules might find that only part of their generation is credited at full value, stretching payback. In some states and utility plans, solar now gets only 10–20% of retail for exports, making off-peak usage or batteries critical.
“I saw a couple install a huge system to eliminate winter bills, but their summer bills stayed higher than expected. We realized their local net-metering plan only credited extra at ~40%. They effectively overbuilt the system. A smaller system optimized for on-site use and adding a small battery would have given a much quicker break-even.”
The takeaway: Poor design or unrealistic plans can erode savings. That’s why an experienced solar advisor designs your system to match your usage profile and local rules.
Ways to Maximize Your Solar Savings
There are many practical steps to squeeze more value from your panels:
- Use power while it’s sunny: Run washers, dishwashers, pool pumps, and EV chargers in midday when solar output peaks. Shifting flexible loads into daylight lets you consume free solar power directly instead of drawing from the grid later.
- Optimize system size: Work with a pro to get the right array size for your needs. Oversizing isn’t free and undersizing leaves savings on the table.
- Monitor and manage usage: Use monitoring apps to track how much solar you produce vs. use. Being aware can reveal small changes (like turning off phantom loads) that boost your net self-consumption and savings.
- Improve home efficiency: The less you use overall, the more of your usage solar can cover. Upgrading insulation, switching to LEDs, or installing a heat pump lowers your baseline consumption, making your solar offset count for a larger share.
- Consider battery storage (if it fits): A home battery lets you store excess midday solar for evening use, increasing self-consumption. Batteries work especially well if your utility uses time-of-use rates (when electricity is expensive at peak hours). However, batteries are costly; calculate if the extra savings (avoided peak rates and better use of off-peak solar) justify the investment. In many cases batteries are valued more for backup power than pure bill savings.
- Maximize incentives and financing: While not directly “savings on bill,” taking full advantage of any remaining local rebates or using a low-interest solar loan can greatly improve your effective payback and net savings. Even though the federal tax credit is gone after 2025, some state/utility programs remain that can offset costs.
“One family I talked to in Florida started charging their EV only during mid-afternoon and installed smart outlets. After a month, they saw their grid purchases drop 30%. Small changes like that can make a surprisingly big difference.”
Is Solar Worth It Financially?
The honest answer: It depends on your circumstances. For many, yes – solar can be a solid long-term investment – but it’s not guaranteed. Here’s a balanced take:
-
When it’s often worth it: In areas with high electricity rates (>$0.12–$0.15/kWh) and plenty of sun, solar systems often pay back in a reasonable timeframe (often 7–12 years). Beyond payback, you’re effectively getting free power. If you plan to stay in your home 15+ years, the lifetime savings can be equivalent to a very high return on investment. DOE analysis even shows that investments under a 10-year payback beat most low-risk alternatives. In simple terms, after you break even, every kWh is free, so long-term owners reap all the upside.
-
When it may be marginal: If you live in a place with very low utility rates (e.g. parts of the Midwest at ~8¢/kWh), solar offsets less money per kWh, making payback slower. Also, if your home’s sun exposure is poor, or you plan to move in a few years, the math changes. Solar yields the most value over decades, so short stays can make it harder to recoup the investment before selling. (Good news: solar can increase home value – studies show a home’s value tends to rise ~4–10% after installing panels – but you can’t cash that out unless you sell.)
-
Overall: Solar is a long-term decision. If you can handle a 10–15 year break-even and enjoy knowing 20 years of cheap power are ahead, it’s likely worth it. If the numbers crunch out to a longer payback or you’re risk-averse, you might find smaller systems or community solar as alternatives. Ultimately, use realistic estimates: take your expected usage, local rates, and a solid quote to project savings. An honest solar consultant will help set expectations – avoiding “instant zero bills” hype and showing real numbers.
“The homeowner who put panels on her house in Arizona told me, ‘I may only save $300 a year on my bill, but I’m locking in my rate for 25 years, and that’s priceless peace of mind with prices soaring.’ Her payback was long, but she valued the certainty and the small monthly savings.”
Understanding your savings potential is only one piece of the solar equation. I’ve seen homeowners save thousands on electricity over the life of their systems, but those savings always need to be viewed alongside installation costs, incentives, and expected return on investment. If you’re still researching the financial side of going solar, our complete guide to how much does solar energy cost breaks down real-world pricing, hidden expenses, and what homeowners can realistically expect to pay and earn back over time.
Frequently Asked Questions
A: Usually not entirely. Solar significantly cuts the amount of grid power you buy (often by 50–80%), but you’ll still receive a bill because panels don’t run 24/7. The bill will mainly show service charges and any net usage. In practice, some owners aim for a very small final bill (just the base fee). Full elimination of the bill is rare unless you go completely off-grid (with batteries and backup).
A: It depends on your costs and savings. Many homeowners pay back their system in 7–12 years through bill savings. After that break-even point, the electricity is “free,” improving your return. If rates are high and incentives used, payback can be under 5 years. If rates are low or system is small, it could be 15+ years. A payback under 10 years is generally considered a strong return.
A: Key factors include how much electricity your household uses, the local price per kWh, your system’s size and orientation, and how much of your usage occurs during sunny hours. Net metering policies also matter – being credited fully for excess solar can greatly boost savings. In short, high usage + high rates + good sun + high self-use = maximum savings.
A: Not necessarily. Batteries allow you to use stored solar at night, increasing self-consumption. They help if your utility has time-of-use pricing or low export credits. However, batteries add substantial cost. For many, batteries pay off more through resilience (backup power) than pure bill savings. Without incentives or very high time-of-use rates, you can still save a lot just with panels and net-metering.
A: You may need a slightly larger system to meet your needs, and some savings potential could be lost. If shade is heavy, output drops and so do savings. In such cases, using micro-inverters or power optimizers (which mitigate shading effects) can help. A solar installer can assess your roof and suggest optimizations so you still capture as much value as possible.
A: Many solar customers see their bills fall by at least 50% on average. For a $150/month bill, solar might cut it down to $30–$75. In very sunny, high-rate areas, bills can become almost zero in summer months. Expect a big drop, but not usually to zero due to nights and fixed charges.
A: Yes. Homes with owned solar panels often sell for 4–10% more than similar homes without solar. This means even if you move before breaking even on bills, you likely recover some system cost in the sale price.
A: No guarantee – savings depend on your real usage and system performance. A well-designed system with good sun exposure almost always saves money over time, but unexpected factors (like policy changes or low production) can affect results. Always review quotes and ask installers to show you projected bills and payback under conservative assumptions.
Conclusion
In summary, solar panels can save a substantial amount on your electricity costs – often tens of thousands of dollars over their lifetime. Typical households see big drops in their monthly bills, though rarely zero out every charge due to nights and fees. The exact savings vary widely based on factors like your energy usage, local rates, roof and system size, and net metering rules. By planning a system to match your home’s usage pattern (maximizing daytime use) and optimizing efficiency, you can make the most of solar.
Realistic expectations are key. In many cases, homeowners see paybacks in under a decade and enjoy decades of virtually free electricity thereafter. In others, savings are more modest. But even modest cuts in a rising-bill world can relieve budget pressure year after year. The long-term benefits – bill stability, reduced carbon footprint, and higher home value – often tip the scales for homeowners.
Solar isn’t a guaranteed windfall, but for many it locks in electricity costs and significantly reduces bills. If you ask, an experienced solar consultant will analyze your specific situation – usage, panels, financing – to give you a clear picture of what your true savings will be. Armed with that knowledge, you can decide if going solar makes financial sense for your home.